- BTC 109316.82 + 0.003%
- DOT 3.865 + 0.0153%
- NEO 5.644 + 0.0161%
- FIO 0.01654 + 0.0213%
- FIL 2.178 + 0.0083%
- TRX 0.3374 + 0.003%
- JUV 1.03 + 0.0505%
- ACM 0.83 + 0.0349%
- FB - %
- AVAX 28.62 + 0.0168%
- ETC 18.14 + 0.0138%
- BNB 969.43 + 0.0316%
- LTC 104.43 + 0.0011%
- ADA 0.7803 + 0.0147%
- XRP 2.7759 + 0.0028%
- CHZ 0.03888 + 0.0188%
- DOGE 0.22888 + 0.0156%
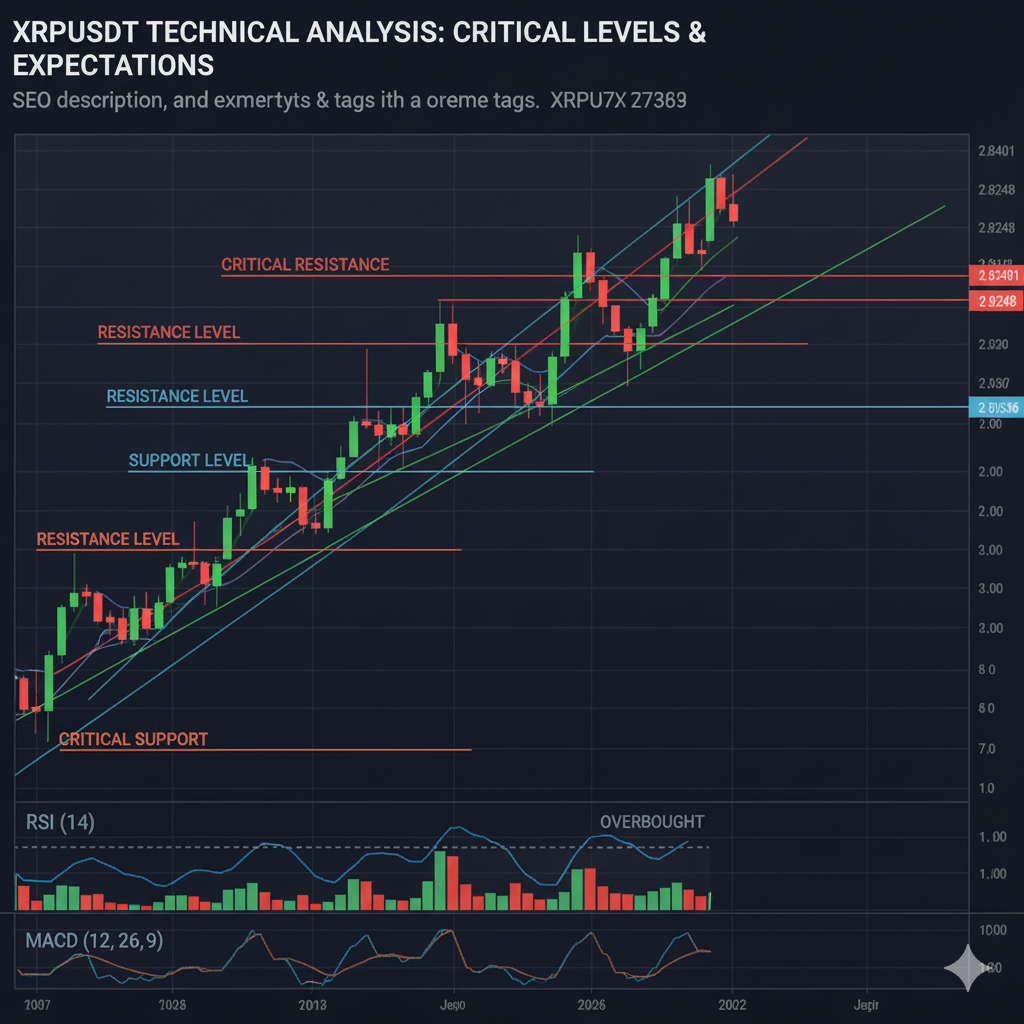
XRPUSDT Technical Analysis: Critical Levels and Expectations
XRPUSDT Technical Analysis: Critical Levels and Potential Movements
The XRPUSDT pair has been exhibiting volatile behavior recently, leading to the formation of critical levels that investors are closely monitoring. Specifically, the levels 2.80536, 2.81466, 2.81508, 2.8248, and 2.8401 are emerging as potential resistance and support points. Breaching or holding these levels could provide important clues about XRPUSDT's future direction.
Resistance Levels and Possible Scenarios
The 2.8401 level is currently seen as the most significant resistance point. If this level is broken, XRPUSDT's upward movement could accelerate, potentially progressing towards higher targets. However, encountering selling pressure at this level could cause the price to move downwards again and test the support levels. The 2.8248 level also stands out as another important resistance point. Breaking this level could signal a continuation of upward momentum. However, profit-taking may occur at this level, and a price pullback could be expected.
Support Levels and Risk Management
The levels 2.81508, 2.81466, and 2.80536 are being considered important support points for XRPUSDT. Holding these levels could help reduce downward pressure and stabilize the price. However, closes below these levels could increase selling pressure and lead to testing of lower levels. Investors can determine their trading strategies by considering these support and resistance levels. In particular, there is potential to profit by buying near support levels and selling near resistance levels. However, it's important for each investor to consider their own risk tolerance and investment goals.
Technical Indicators and Trend Analysis
When examining technical indicators for XRPUSDT, it is important to pay attention to whether oscillators such as the RSI (Relative Strength Index) and MACD (Moving Average Convergence Divergence) are in overbought or oversold zones. These indicators can help measure how quickly the price is rising or falling and the strength of the trend. Moving averages are also an important tool for trend analysis. In particular, the intersections of the 50-day and 200-day moving averages can provide important signals about the long-term trend. For example, the 50-day moving average crossing the 200-day moving average upward could indicate the beginning of an upward trend.
Volatility and Market Sentiment
It should be remembered that XRPUSDT has a volatile structure. Especially in times of increased uncertainty in the market, price fluctuations can become more pronounced. Therefore, it is important for investors to be careful and implement risk management strategies. Market sentiment is also an important factor affecting the price of XRPUSDT. In particular, movements in Bitcoin and other major cryptocurrencies can also affect XRPUSDT. Therefore, it is important to follow general market trends and monitor the news flow.
Conclusion and Recommendations:
For XRPUSDT, the levels 2.80536, 2.81466, 2.81508, 2.8248, and 2.8401 stand out as critical support and resistance points. Investors can determine their trading strategies by considering these levels. However, it is important for each investor to consider their own risk tolerance and investment goals. Technical indicators and trend analysis can also provide important clues about the future direction of XRPUSDT. However, technical analysis alone is not sufficient and market sentiment should also be taken into account.
This article does not constitute investment advice. The content provided here is solely for informational purposes and reflects the results generated by Aiwalleto's AI analysis system. Before making any financial decisions, you should conduct your own research or consult with a licensed financial advisor.
To access advanced trading tools and in-depth analytics, register on our platform.Technical Analysis Points
- Min 2.80536
- Support 2.81466
- Support 2.81508
- Support 2.8248
- Max 2.8401