- BTC 109316.82 + 0.003%
- DOT 3.865 + 0.0153%
- NEO 5.644 + 0.0161%
- FIO 0.01654 + 0.0213%
- FIL 2.178 + 0.0083%
- TRX 0.3374 + 0.003%
- JUV 1.03 + 0.0505%
- ACM 0.83 + 0.0349%
- FB - %
- AVAX 28.62 + 0.0168%
- ETC 18.14 + 0.0138%
- BNB 969.43 + 0.0316%
- LTC 104.43 + 0.0011%
- ADA 0.7803 + 0.0147%
- XRP 2.7759 + 0.0028%
- CHZ 0.03888 + 0.0188%
- DOGE 0.22888 + 0.0156%
ADA/USDT Technical Analysis: Critical Levels and Potential Movements
ADA/USDT Technical Analysis: Key Levels and Possible Scenarios
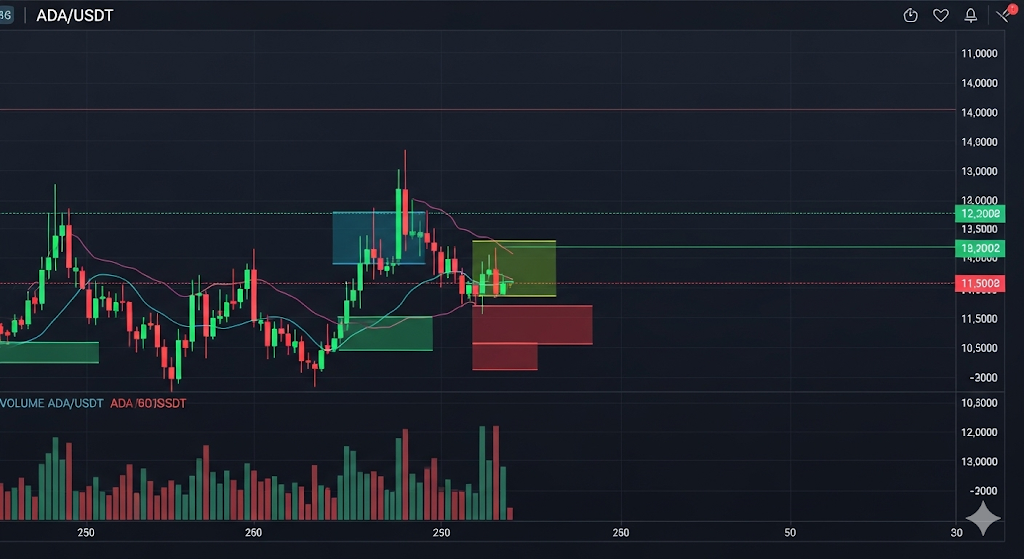
Cardano (ADA) has recently continued to show a volatile trend in the cryptocurrency market. Especially the ADA/USDT pair is consolidating around certain support and resistance levels, generating critical signals for investors when making buy and sell decisions. In this article, we will examine the key levels and possible scenarios for ADA/USDT.
ADA/USDT Support Levels: Buying Opportunities
Why Are 0.8584 and 0.85962 Critical?
For ADA/USDT, the 0.8584 and 0.85962 levels create a strong support zone. In particular, 0.8584 has historically acted as a solid support point that has been tested multiple times. Pullbacks into this zone may provide short-term buying opportunities.
If this support is maintained, it could serve as a strong foundation for the continuation of the bullish trend.
ADA/USDT Resistance Levels: Selling Pressure and Possible Breakouts
The Critical Barrier Between 0.87466 – 0.89662
On the upside, 0.87466, 0.89338, and especially 0.89662 emerge as key resistance points.
-
0.87466: The first short-term resistance level.
-
0.89338: A level where selling pressure could increase in the medium term.
-
0.89662: The most important barrier for ADA. If a sustained close occurs above this level, the price may target 0.90 and beyond.
Technical Indicators and Trend Analysis
The Impact of Moving Averages on ADA/USDT
The 50-day and 200-day moving averages are crucial in determining the trend direction for ADA/USDT. If the short-term average crosses above the long-term average, it strengthens the bullish signal.
RSI and MACD Signals
-
RSI (Relative Strength Index): If it moves into the overbought zone, a pullback could follow; in the oversold zone, a recovery may be expected.
-
MACD: A positive crossover suggests strengthening bullish momentum, while a negative crossover increases the likelihood of a bearish move.
Volatility and Risk Management for ADA/USDT
The Importance of Stop-Loss and Take-Profit Levels
Given the high volatility in the crypto market, risk management is crucial for ADA/USDT traders.
-
Stop-loss orders help limit potential losses.
-
Setting take-profit targets ensures gains are secured before a reversal occurs.
These strategies are essential for long-term success.
Possible Scenarios for ADA/USDT: Bullish or Bearish?
Bullish Scenario: Above 0.89662
If ADA/USDT breaks above 0.89662 and holds above it, the pair is likely to move toward 0.90 and higher levels.
Bearish Scenario: Breaking the 0.8584 Support
If the 0.8584 support level fails, the price could retest 0.84 or even lower levels.
Conclusion: What Should Investors Watch in ADA/USDT?
The ADA/USDT pair continues to fluctuate between key support and resistance levels. Therefore, investors should closely monitor:
-
The 0.8584 – 0.85962 support zone,
-
The 0.87466 – 0.89662 resistance range,
-
Technical indicators such as RSI and MACD.
Market news, general crypto trends, and strong risk management strategies will directly influence the success of positions taken in ADA/USDT.
📌 Disclaimer: This content is for informational purposes only and does not constitute investment advice.
This article does not constitute investment advice. The content provided here is solely for informational purposes and reflects the results generated by Aiwalleto's AI analysis system. Before making any financial decisions, you should conduct your own research or consult with a licensed financial advisor.
To access advanced trading tools and in-depth analytics, register on our platform.Technical Analysis Points
- Min 0.8584
- Support 0.85962
- Support 0.87466
- Support 0.89338
- Max 0.89662