- BTC 109316.82 + 0.003%
- DOT 3.865 + 0.0153%
- NEO 5.644 + 0.0161%
- FIO 0.01654 + 0.0213%
- FIL 2.178 + 0.0083%
- TRX 0.3374 + 0.003%
- JUV 1.03 + 0.0505%
- ACM 0.83 + 0.0349%
- FB - %
- AVAX 28.62 + 0.0168%
- ETC 18.14 + 0.0138%
- BNB 969.43 + 0.0316%
- LTC 104.43 + 0.0011%
- ADA 0.7803 + 0.0147%
- XRP 2.7759 + 0.0028%
- CHZ 0.03888 + 0.0188%
- DOGE 0.22888 + 0.0156%
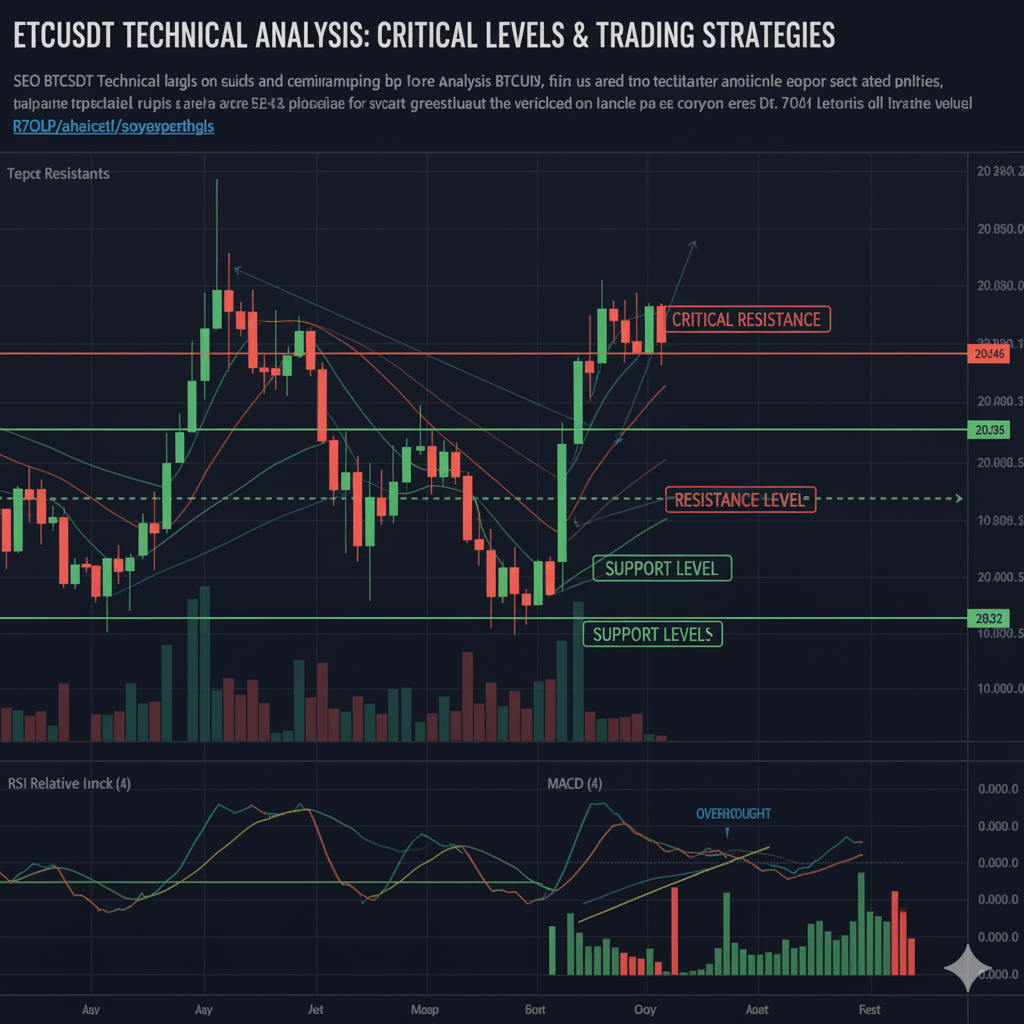
ETCUSDT Technical Analysis: Critical Levels and Trading Strategies
ETCUSDT Technical Analysis: Critical Levels and Potential Movements
Ethereum Classic (ETC) is known as one of the established players in the cryptocurrency market, and the ETCUSDT parity is a closely monitored indicator for investors. In this analysis, we will evaluate potential resistance and support levels for ETCUSDT, focusing on specific price points (20.22, 20.28, 20.346, 20.346, 20.648).
Support Levels and Buying Opportunities:
The 20.22 and 20.28 levels can be considered important support zones for ETCUSDT. A decline in price to these levels may create buying opportunities. In particular, the 20.22 level stands out as a stronger support point. Testing this level could be a signal for buyers to enter the market.
Resistance Levels and Selling Pressure:
The 20.346 and 20.648 levels are potential resistance points. A rise in price to these levels may increase selling pressure and hinder the upward movement. Especially the 20.648 level can be assessed as a stronger resistance. Overcoming this level is critical for the continuation of the upward movement for ETCUSDT.
Interpretation of Price Movements:
Falling Below 20.22:
If the price falls below the 20.22 level, it may indicate a continuation of the downtrend and could lead to targeting lower levels.
Rising Above 20.648:
If the price rises above the 20.648 level, it indicates that the uptrend is strengthening and increases the potential to reach higher targets.
Important Notes:
* This analysis focuses on the specified price points and does not take into account general market conditions. * Before making investment decisions, it is important to do your own research and assess your risk tolerance. * Technical analysis is based on probabilities and does not guarantee definitive results.
Conclusion:
For ETCUSDT, the 20.22 and 20.28 levels stand out as support, while the 20.346 and 20.648 levels are highlighted as resistance points. Investors can develop buying and selling strategies by taking these levels into account. However, due to the volatile nature of the market, it is important to be careful and adhere to risk management principles.
Additionally:
* Following current news and market analysis can support your investment decisions. * You can use different technical analysis tools (e.g., moving averages, RSI, MACD) to make a more comprehensive assessment.
This article does not constitute investment advice. The content provided here is solely for informational purposes and reflects the results generated by Aiwalleto's AI analysis system. Before making any financial decisions, you should conduct your own research or consult with a licensed financial advisor.
To access advanced trading tools and in-depth analytics, register on our platform.Technical Analysis Points
- Min 20.22
- Support 20.28
- Support 20.346
- Support 20.346
- Max 20.648