• BTC 109316.82 + 0.003%
  • DOT 3.865 + 0.0153%
  • NEO 5.644 + 0.0161%
  • FIO 0.01654 + 0.0213%
  • FIL 2.178 + 0.0083%
  • TRX 0.3374 + 0.003%
  • JUV 1.03 + 0.0505%
  • ACM 0.83 + 0.0349%
  • FB - %
  • AVAX 28.62 + 0.0168%
  • ETC 18.14 + 0.0138%
  • BNB 969.43 + 0.0316%
  • LTC 104.43 + 0.0011%
  • ADA 0.7803 + 0.0147%
  • XRP 2.7759 + 0.0028%
  • CHZ 0.03888 + 0.0188%
  • DOGE 0.22888 + 0.0156%
Bitcoin (BTC) Technical Analysis: Critical Levels and Potential Scenarios

Bitcoin (BTC) Technical Analysis: Critical Levels and Potential Scenarios

Bitcoin (BTC), as the flagship of the cryptocurrency market, remains an asset closely monitored by investors and analysts. While recent price movements indicate prevailing uncertainty in the market, technical analysis tools and critical levels can offer significant clues about potential future scenarios. In this analysis, we will evaluate the recent price movements of the BTCUSDT pair, attempting to identify potential support and resistance points.

Price Movements and Key Levels

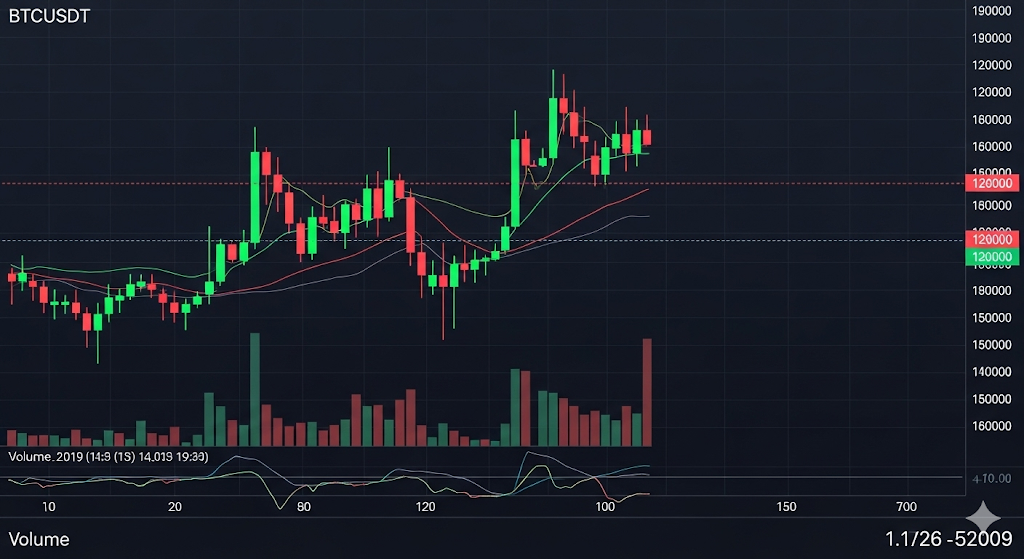
According to recent data, the BTCUSDT pair is fluctuating at levels of 115026.45, 115203.552, 115280.992, 115406.604, and 116350.718. These levels can be considered important reference points for short-term investors. In particular, the 115026.45 level stands out as a potential support point, while the 116350.718 level can be assessed as resistance.

Importance of Support and Resistance Points

Support points represent levels where the price may stop falling and buyers may step in. If a breakout below the 115026.45 level occurs, a decline towards lower levels is likely. Resistance points, on the other hand, are levels where the price may be prevented from rising and selling pressure may increase. If the 116350.718 level is surpassed, an upward movement towards higher levels can be expected.

Technical Indicators and Possible Scenarios

Technical indicators such as moving averages (MA), the relative strength index (RSI), and MACD can provide additional information about price movements. For example, the RSI being in overbought or oversold regions may indicate that the price may reverse. Crossovers in the MACD can be interpreted as buy or sell signals.

Possible Scenarios

Bullish Scenario:

 116350.718 resistance is broken, the uptrend in the BTCUSDT pair is expected to continue. In this case, the next target levels will be higher resistance points.

Bearish Scenario:

115026.45 support is broken, the downtrend in the BTCUSDT pair is expected to accelerate. In this case, the next target levels will be lower support points. *

Consolidation Scenario:

If the price moves horizontally within a certain range (e.g., 115026.45 - 116350.718), it can be said that uncertainty persists in the market. In this case, investors are advised to be more cautious and wait for a new trend to form.

Risk Management and Investment Advice

Since the cryptocurrency market has high volatility, it is important for investors to carefully implement risk management strategies. Limiting potential losses by using stop-loss orders and setting profit-taking levels are an important part of a successful investment strategy. This analysis is for informational purposes only and should not be considered investment advice. Each investor must make decisions based on their own risk tolerance and investment goals.

In summary,

the BTCUSDT pair is moving at critical support and resistance levels. The 115026.45 level stands out as support, while the 116350.718 level stands out as resistance. Investment decisions should be made carefully, taking into account technical indicators and possible scenarios. Remember, the cryptocurrency market involves high risk, and there is always the possibility of loss.


This article does not constitute investment advice. The content provided here is solely for informational purposes and reflects the results generated by Aiwalleto's AI analysis system. Before making any financial decisions, you should conduct your own research or consult with a licensed financial advisor.

To access advanced trading tools and in-depth analytics, register on our platform.

Technical Analysis Points

  • Min 115026.45
  • Support 115203.552
  • Support 115280.992
  • Support 115406.604
  • Max 116350.718

FAQ's

  • What is the meaning of the support and resistance levels for BTCUSDT?

    Support levels are price areas where a decline is expected to stop because buyers are entering the market. For example, the 112234.71 level in the analysis. Resistance levels are areas where an increase in price is expected to halt due to increased selling pressure. The 114668.42 level is an example of this.

  • What happens if the price falls below a support level or breaks above a resistance level?

    If the price breaks below a support level, it could signal a continuation of the downtrend and potentially lead to lower prices. If the price breaks above a resistance level, it can be interpreted as a strong signal that the uptrend will continue.

  • What does "consolidation" mean in this analysis?

    Consolidation describes a period where the asset's price moves within a narrow range between its support and resistance levels. This indicates market indecision and suggests that the market is preparing for a significant price move in the future.

  • Why are technical indicators like RSI and MACD important?

    RSI (Relative Strength Index) helps determine if an asset is overbought or oversold, which can suggest a potential price reversal. MACD (Moving Average Convergence Divergence) helps identify momentum and potential trend changes. These indicators assist in predicting future price movements.

  • What is required for the bullish scenario to take place?

    According to the analysis, the bullish scenario will occur if BTCUSDT successfully breaks through the 114668.42 resistance level. This breakthrough is considered a strong signal that the upward trend will continue.

  • What are the target prices in the bearish scenario?

    In the bearish scenario, if the 112234.71 support level is broken, the next price targets could be 111000 and lower.

  • Why is it recommended to "avoid leveraged trading"?

    Cryptocurrency markets are known for their high volatility. While leveraged trading can magnify profits, it can also lead to significant losses from even small price movements. The advice to avoid it is a key part of managing risk.

  • Why is it important to set "stop-loss" levels?

    A stop-loss order is a crucial risk management tool. It automatically closes your position at a predetermined price if the market moves against you, helping to limit potential losses.

  • Should this analysis be considered investment advice?

    No. As the analysis clearly states, it is for informational purposes only and should not be taken as investment advice. It's crucial for investors to do their own research and make decisions based on their own risk tolerance.

  • How can an investor use this technical analysis?

    An investor can use this analysis as a guide to understand potential buying and selling points. However, they should always conduct their own research, use risk management tools like a stop-loss, and consider other market factors like news and macroeconomic data.